
Handling data in football

KS2,Lower Key Stage 2
Maths

Handling data in football

KS2, Lower Key Stage 2
Statistics, Analysing data

This pack helps pupils to read and display fun football statistic data in bar charts.

Pupils will be supported to understand and use the important features needed to create their own bar charts.

What resources are in this pack?

How long does it take to deliver this pack?

clock This should be around 30 - 50 minutes.

Learning outcomes

Pupils will be able to:

  • explain why charts are useful
  • present data using a bar chart
  • interpret data using bar charts
  • solve comparison, sum and difference problems using information presented in bar charts.

In a hurry?

To get an instant zip folder of all downloads, you must first sign in...

Sign in
video

Film: Handling data in football

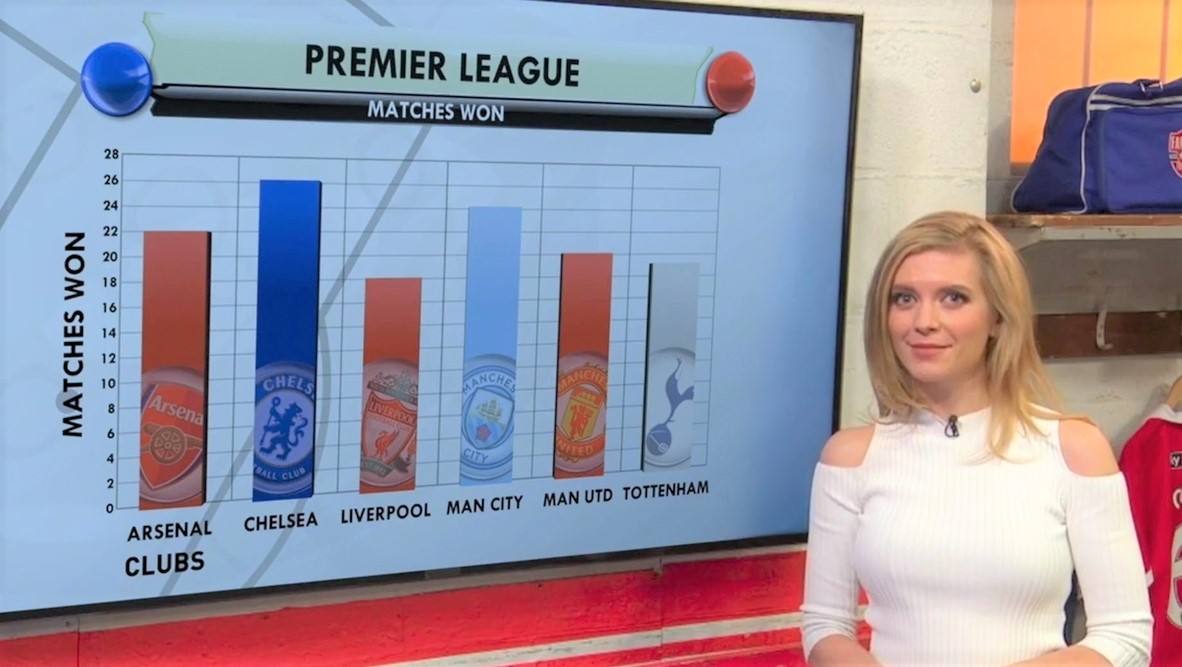
Mathematician and TV presenter Rachel Riley introduces the concept of handling data in football. In the film, she explains how bar charts work, why they are useful, and the important features children need to remember to include in their own bar charts.


activity

Quiz: Handling data in football

This fun quiz tests pupils' ability to read and interpret data from bar charts.

Answers can be found at the end of the quiz.


activity

Activity sheets: Football Scores

Pupils can practise drawing bar charts using activity sheets which are based on stats from Premier League football matches. There are 3 levels (1 is easier and 3 is harder) and children can choose which one they want to do.

Answers are included in a separate sheet. 


activity

Active maths: Team bar charts

This resource can be used to support pupils' active learning, allowing them to demonstrate their abilities to give and follow directions in a practical setting.


activity

Bar chart challenge

Use this activity sheet to get pupils to put their new skills to the test, and consolidate learning outside of the classroom.

This resource is suitable for home learning.