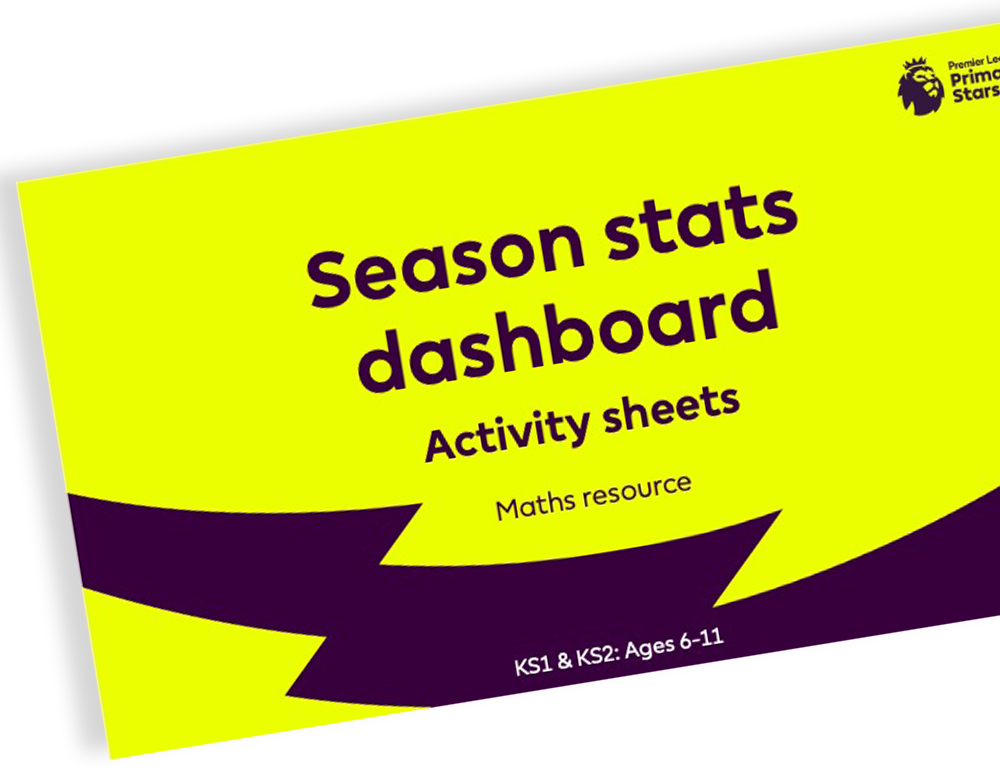
Season Stats Dashboard
Use real data and stats from the Premier League season to engage pupils in Maths.
Use real data and stats from the Premier League season to engage pupils in Maths.
Bring Maths alive using real-world data with the new Season Stats Dashboard. Use real player and match statistics from the Premier League season to engage pupils and support their learning. These flexible resources provide suggested activities to use alongside the dashboard to match your learning objectives.
This resource has also been adapted for home learning. Families can look at the dashboard together to practise their maths skills. Explore the Home/School - Season Stats Dashboard resource pack.
Pupils will be able to practise their:
England: Maths (Key Stage 1 and 2)
Wales: Mathematics and Numeracy (Progression Steps 1, 2 and 3)
View and download individual resources
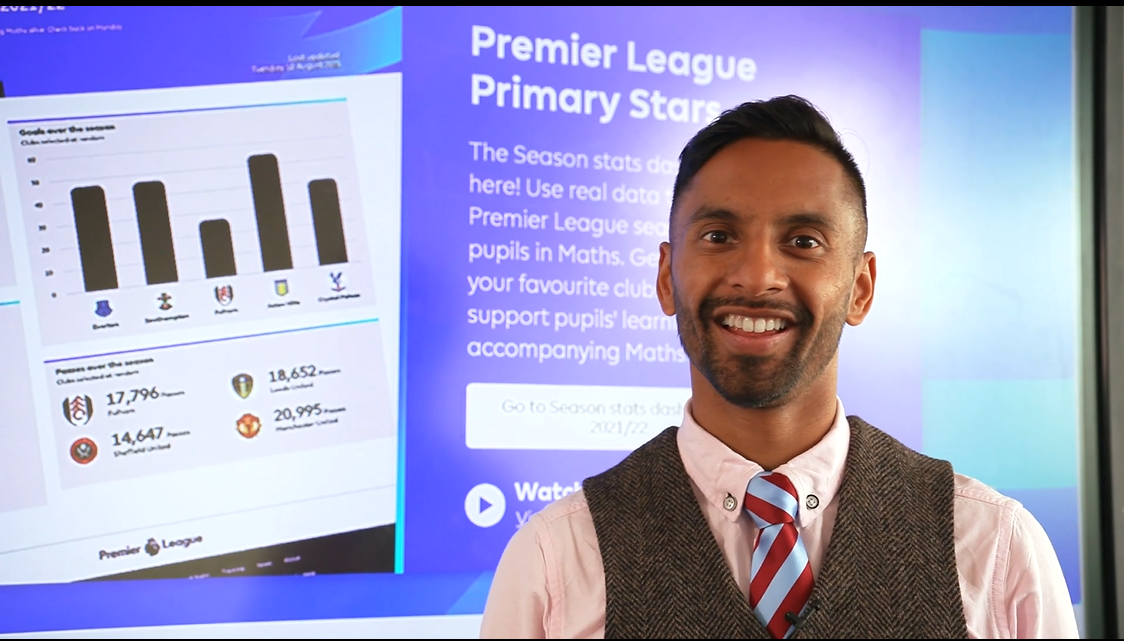
Mathematician, Bobby Seagull introduces the Season stats dashboard. Watch the video to get inspiration on how to use it with your pupils.

This is a flexible resource for teachers to use as they choose, with a few examples included of how the Season stats dashboard might be incorporated into planning, teaching and link to curriculum requirements. The resources lend themselves to either starter activities within a Maths lesson or as a start of the day activity. The focus is to practise key maths skills in a fun and engaging context based on real life data.
These curriculum-linked, editable worksheets can be used in conjunction with the dashboard. As the numbers on the dashboard will vary week to week, ideas are generally provided but teachers can selected data based on what they require pupils to practise.